Dashboards
A dashboard gathers several saved queries onto one page, so your team reads them together instead of opening one link at a time. This is beta: it works, and it is still changing.
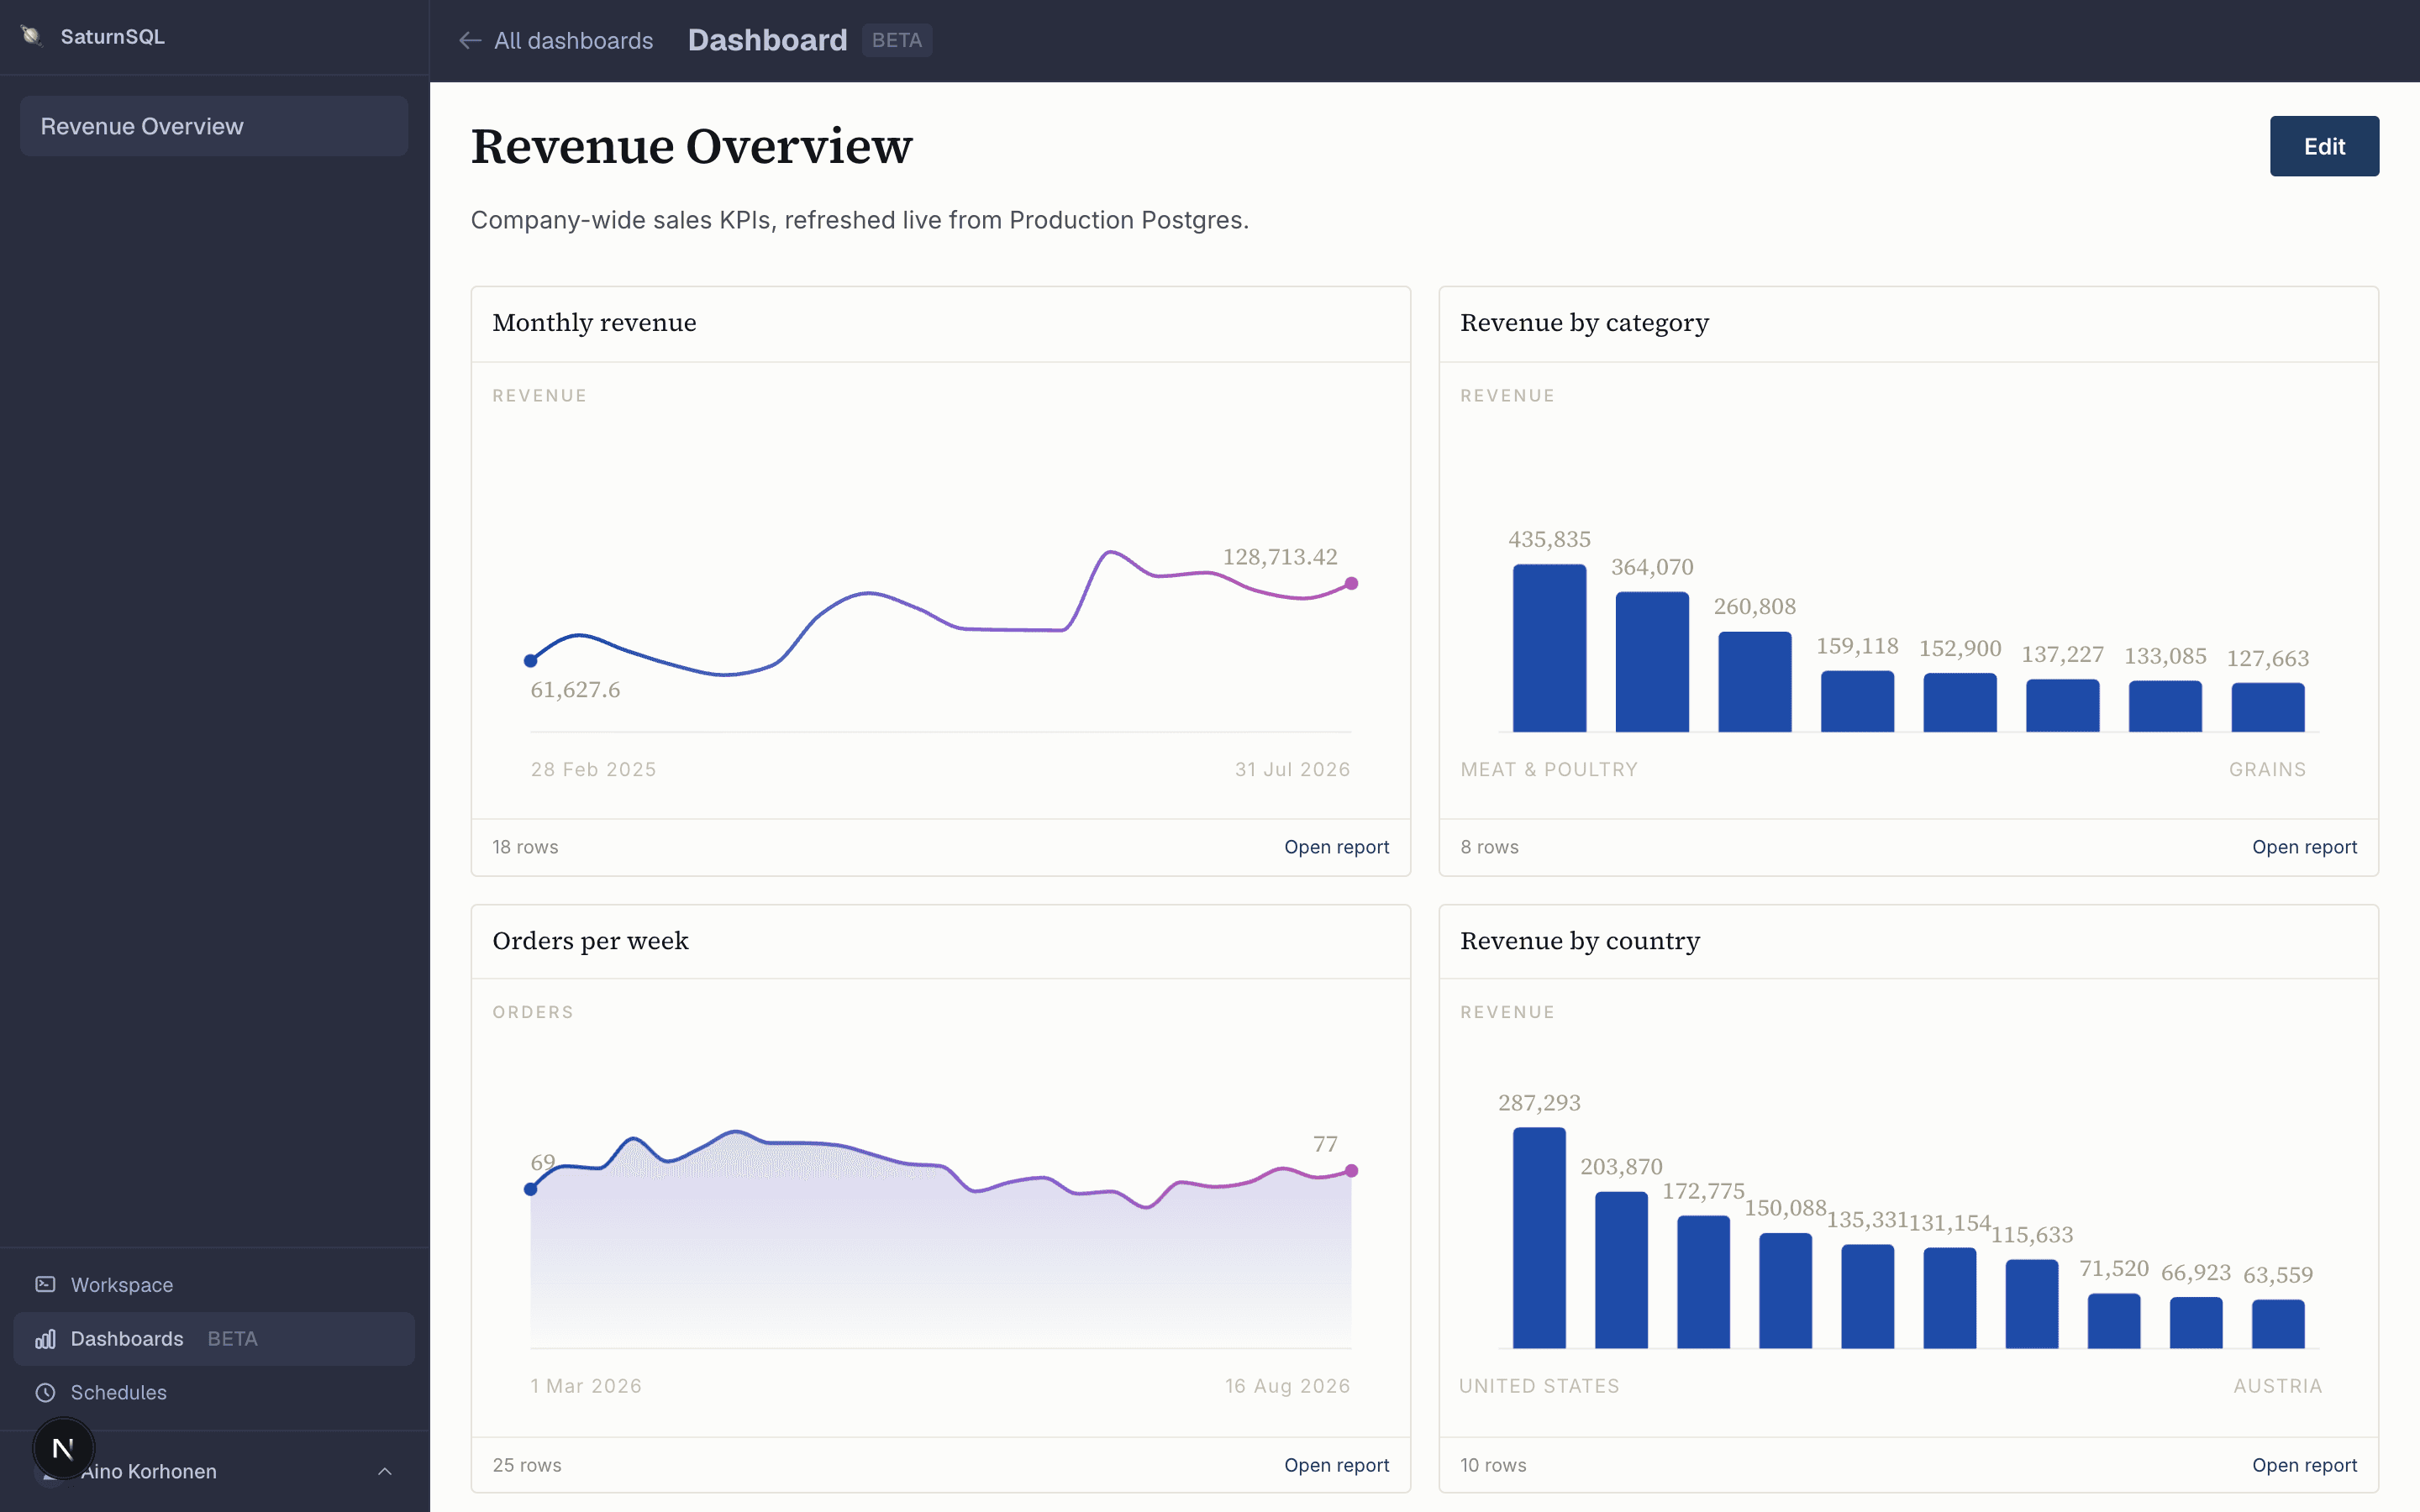
What a dashboard is
Each saved query on a dashboard sits in its own tile, but the filters at the top are shared: one bar covering every tile you can see, not one bar per tile. That bar is the union of whatever those queries ask for, so a dashboard with a “region” filter on two tiles and a “start date” filter on a third shows all three controls once each.
Building one
Start from either end. Click Dashboards in the sidebar and press New dashboard, then add queries to it. Or run a query in the editor and press Add to dashboard above the results to send it to a dashboard you already have, or a new one.
If the query you are adding is still private, you are asked whether to share it first. That is not a formality: until it is shared, teammates who open the dashboard see nothing where that tile should be, which reads as broken even though nothing is wrong. You can share it on the spot, add it privately anyway and share it later, or cancel.
Sharing and who sees what
A tile is only ever as visible as the query behind it. Add a private query to a shared dashboard and the tile does not become visible to anyone else just because the dashboard is shared, it stays visible to you alone until you share the query itself.
What a teammate sees when a tile does not qualify depends on what they can do. A viewer never sees it at all, not even a gap, so they cannot tell there was ever anything there. If you can edit the dashboard, you see a placeholder in its place instead, naming the tile, so you know something needs your attention rather than assuming the dashboard is simply smaller than you built it.
Folders
Dashboards can be filed into a folder, one level deep. Set it in the edit dialog, under the title and description, or leave it blank to keep the dashboard at the top. There is no separate screen for managing folders: a folder exists only because a dashboard is filed in it, and it disappears on its own once nothing is.
One tile means the full report
When you can only see one tile on a dashboard, whether because that is all there is or because the rest are not shared with you, that tile stops being a glance and becomes the full report: every row, paginated, with CSV, Excel and JSON export and a Copy link button at the bottom. With more than one visible tile, each one shows a short preview instead and links out to its own report.
Update and freshness
Opening a dashboard can show you a cached result, which is what makes it load quickly. Press Update and every visible tile reads the database again, live.
Drilling in
Every tile has its own report page underneath it, with the same filters, the full table and export. Click Open report at the bottom of a tile and you go straight there, carrying the dashboard's current filter values with it.
